Dashboards
Mod Ecosystem Health
This dashboard offers a high-level perspective on your modding community, capturing overall ecosystem health and the level of player interaction with mods in-game. Tile figures are all-time totals.
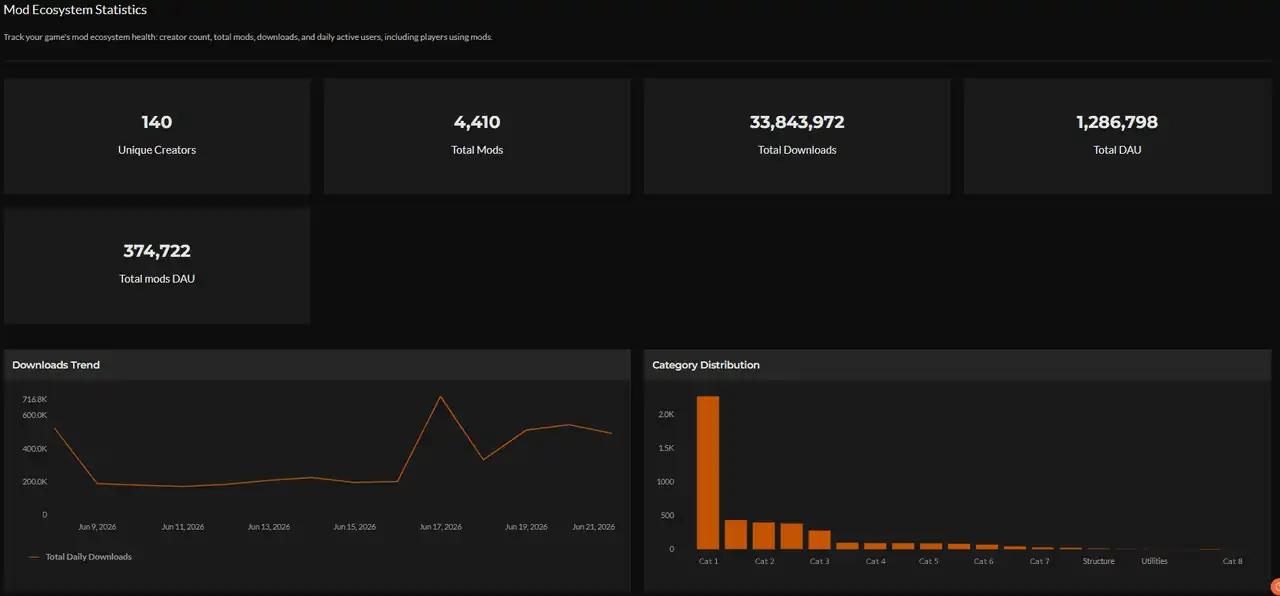
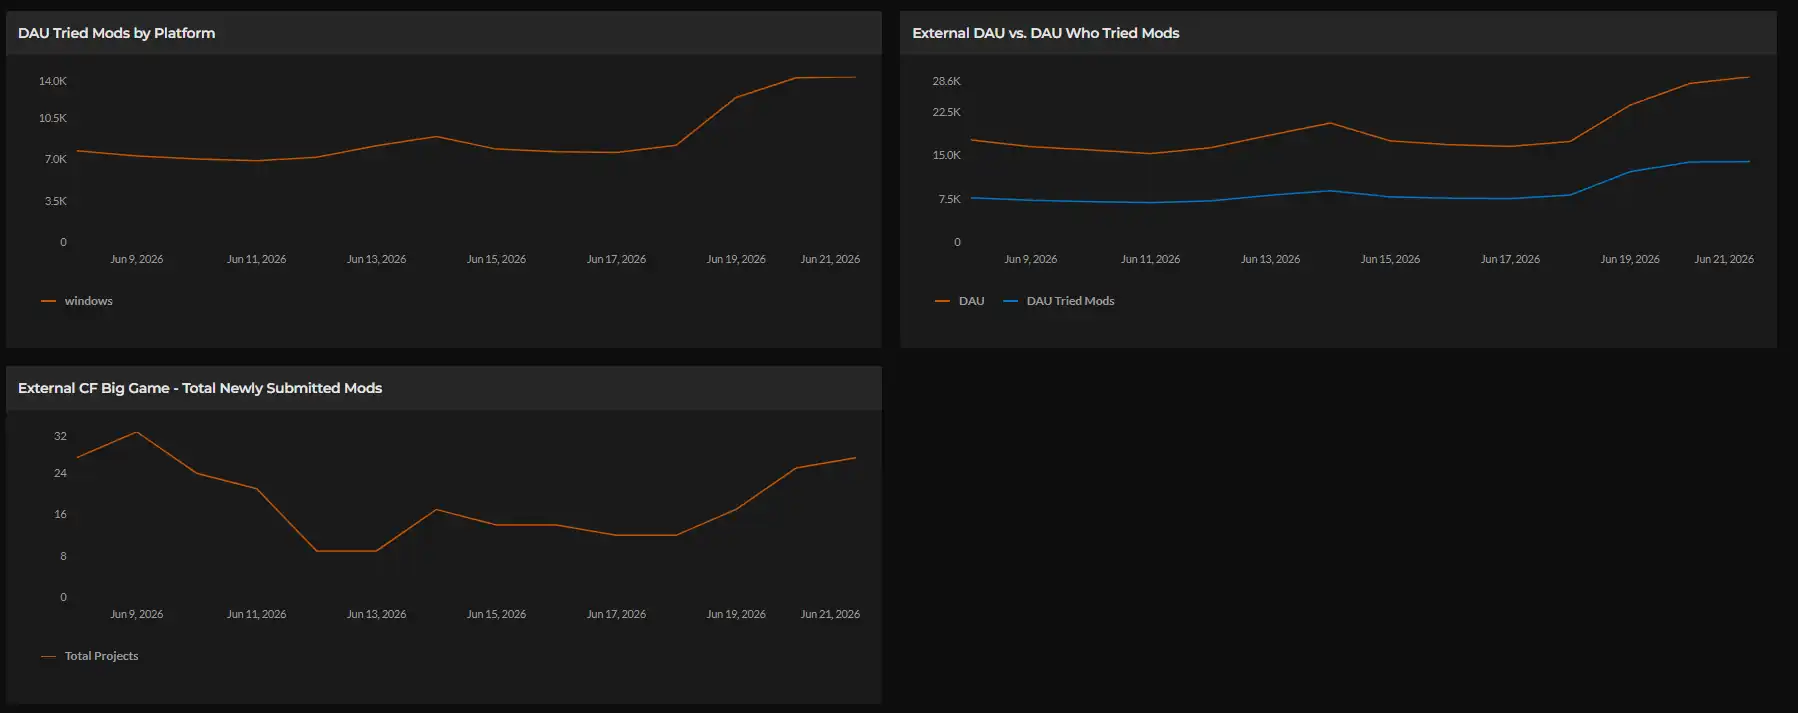
| Widget | What it shows |
|---|---|
| Unique Creators | Total distinct mod authors who have published at least one mod for your game. |
| Total Mods | Total mods published across all platforms. |
| Total Downloads | Total mod file downloads across all platforms. |
| Total DAU | Daily active users across your game, all platforms. |
| Total Mods DAU | DAU who interacted with at least one mod during their session. |
| Downloads Trend | Time-series chart of mod downloads over time. |
| Category Distribution | Download volume broken down by mod category. |
| DAU Tried Mods by Platform | DAU who engaged with mods, broken down by platform (PS5, Windows, Xbox Series S/X). |
| External DAU vs. DAU Who Tried Mods | Total DAU compared against the subset who engaged with mods. Use this to track mod adoption across your player base. |
| Total Newly Submitted Mods | New mod submissions over time. Use this to monitor content supply health. |
Premium Mods
Available to authors in the CurseForge for Authors portal under Statistics > Premium Mods. Data is shown per-mod (filterable by project) for authors. Data is aggregated across the full game ecosystem for studio-side visibility (coming soon).
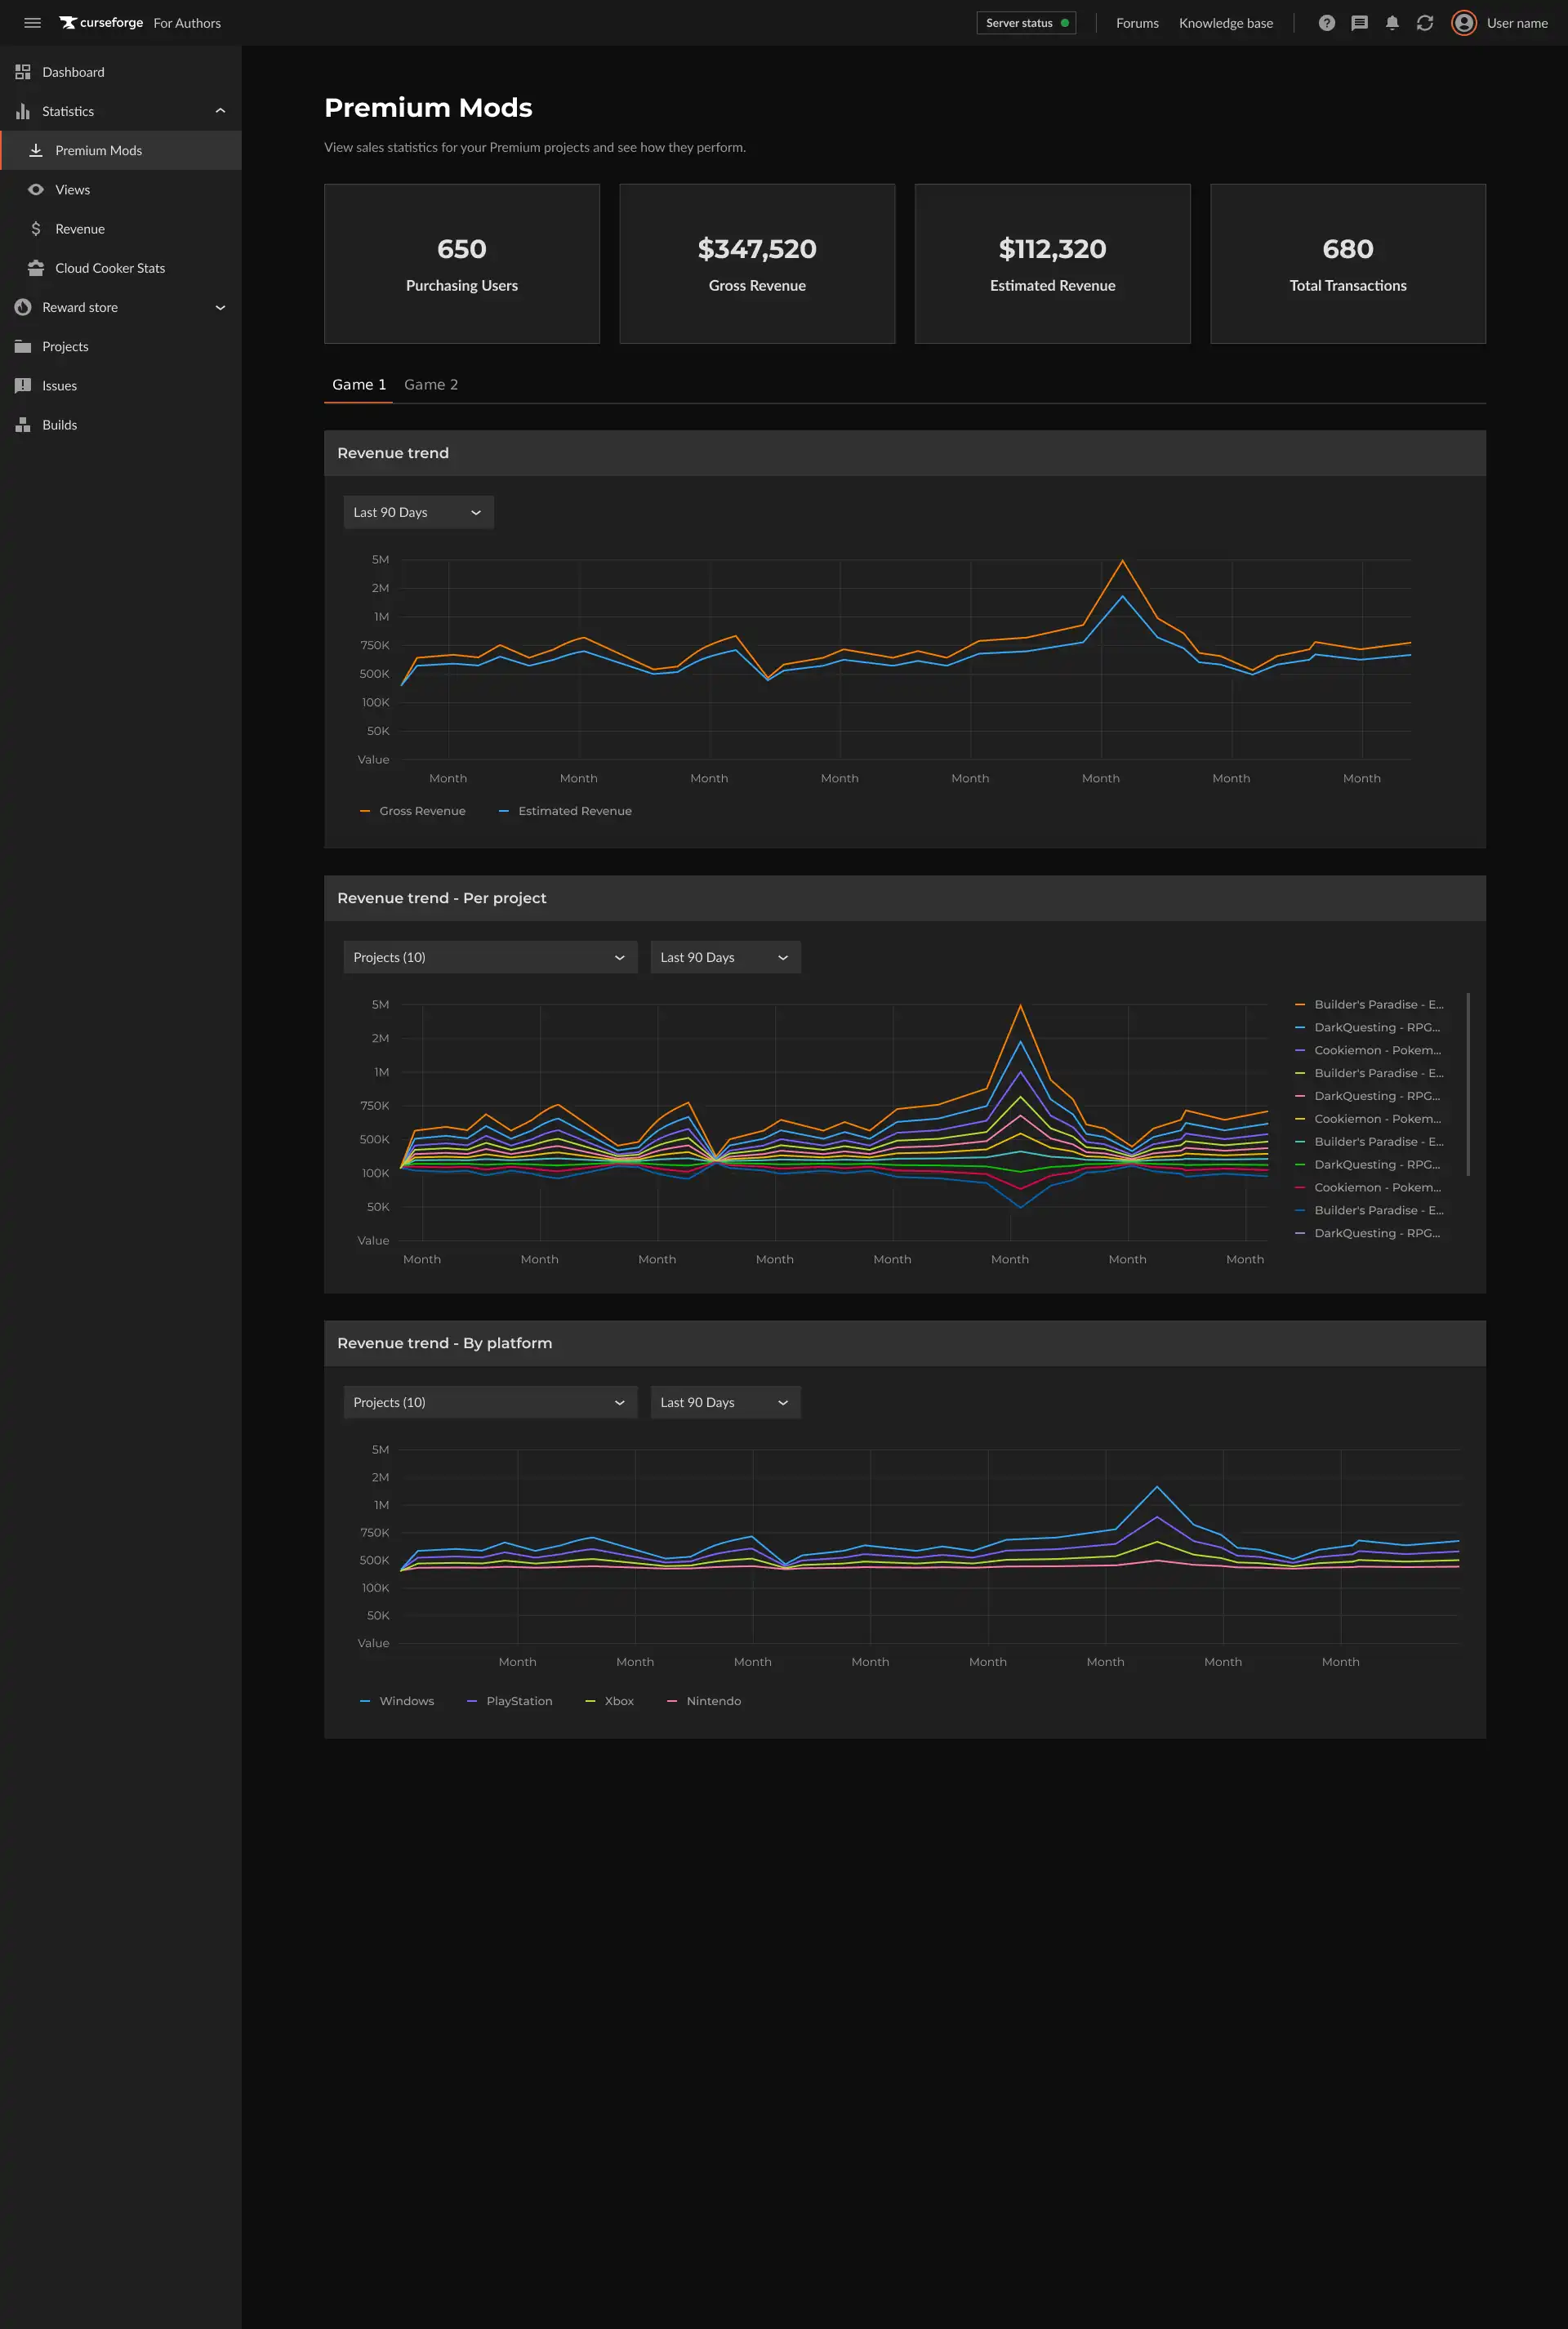
| Widget | What it shows |
|---|---|
| Purchasing Users | Total unique users who completed at least one premium mod purchase. |
| Gross Revenue ($) | Total revenue before platform fees. |
| Transactions | Total number of completed purchase transactions. |
| Estimated Revenue ($) | Revenue after platform fees. This is the amount the author receives. |
| Revenue Trend (List Prices $) | Time-series chart of revenue at list price over time. |
| Revenue Trend (per project) | Time-series chart of revenue at list price over time, broken down by project. |
| Revenue Trend (by platform) | Time-series chart of revenue at list price over time, broken down by platform. |
Cloud Cooker Status
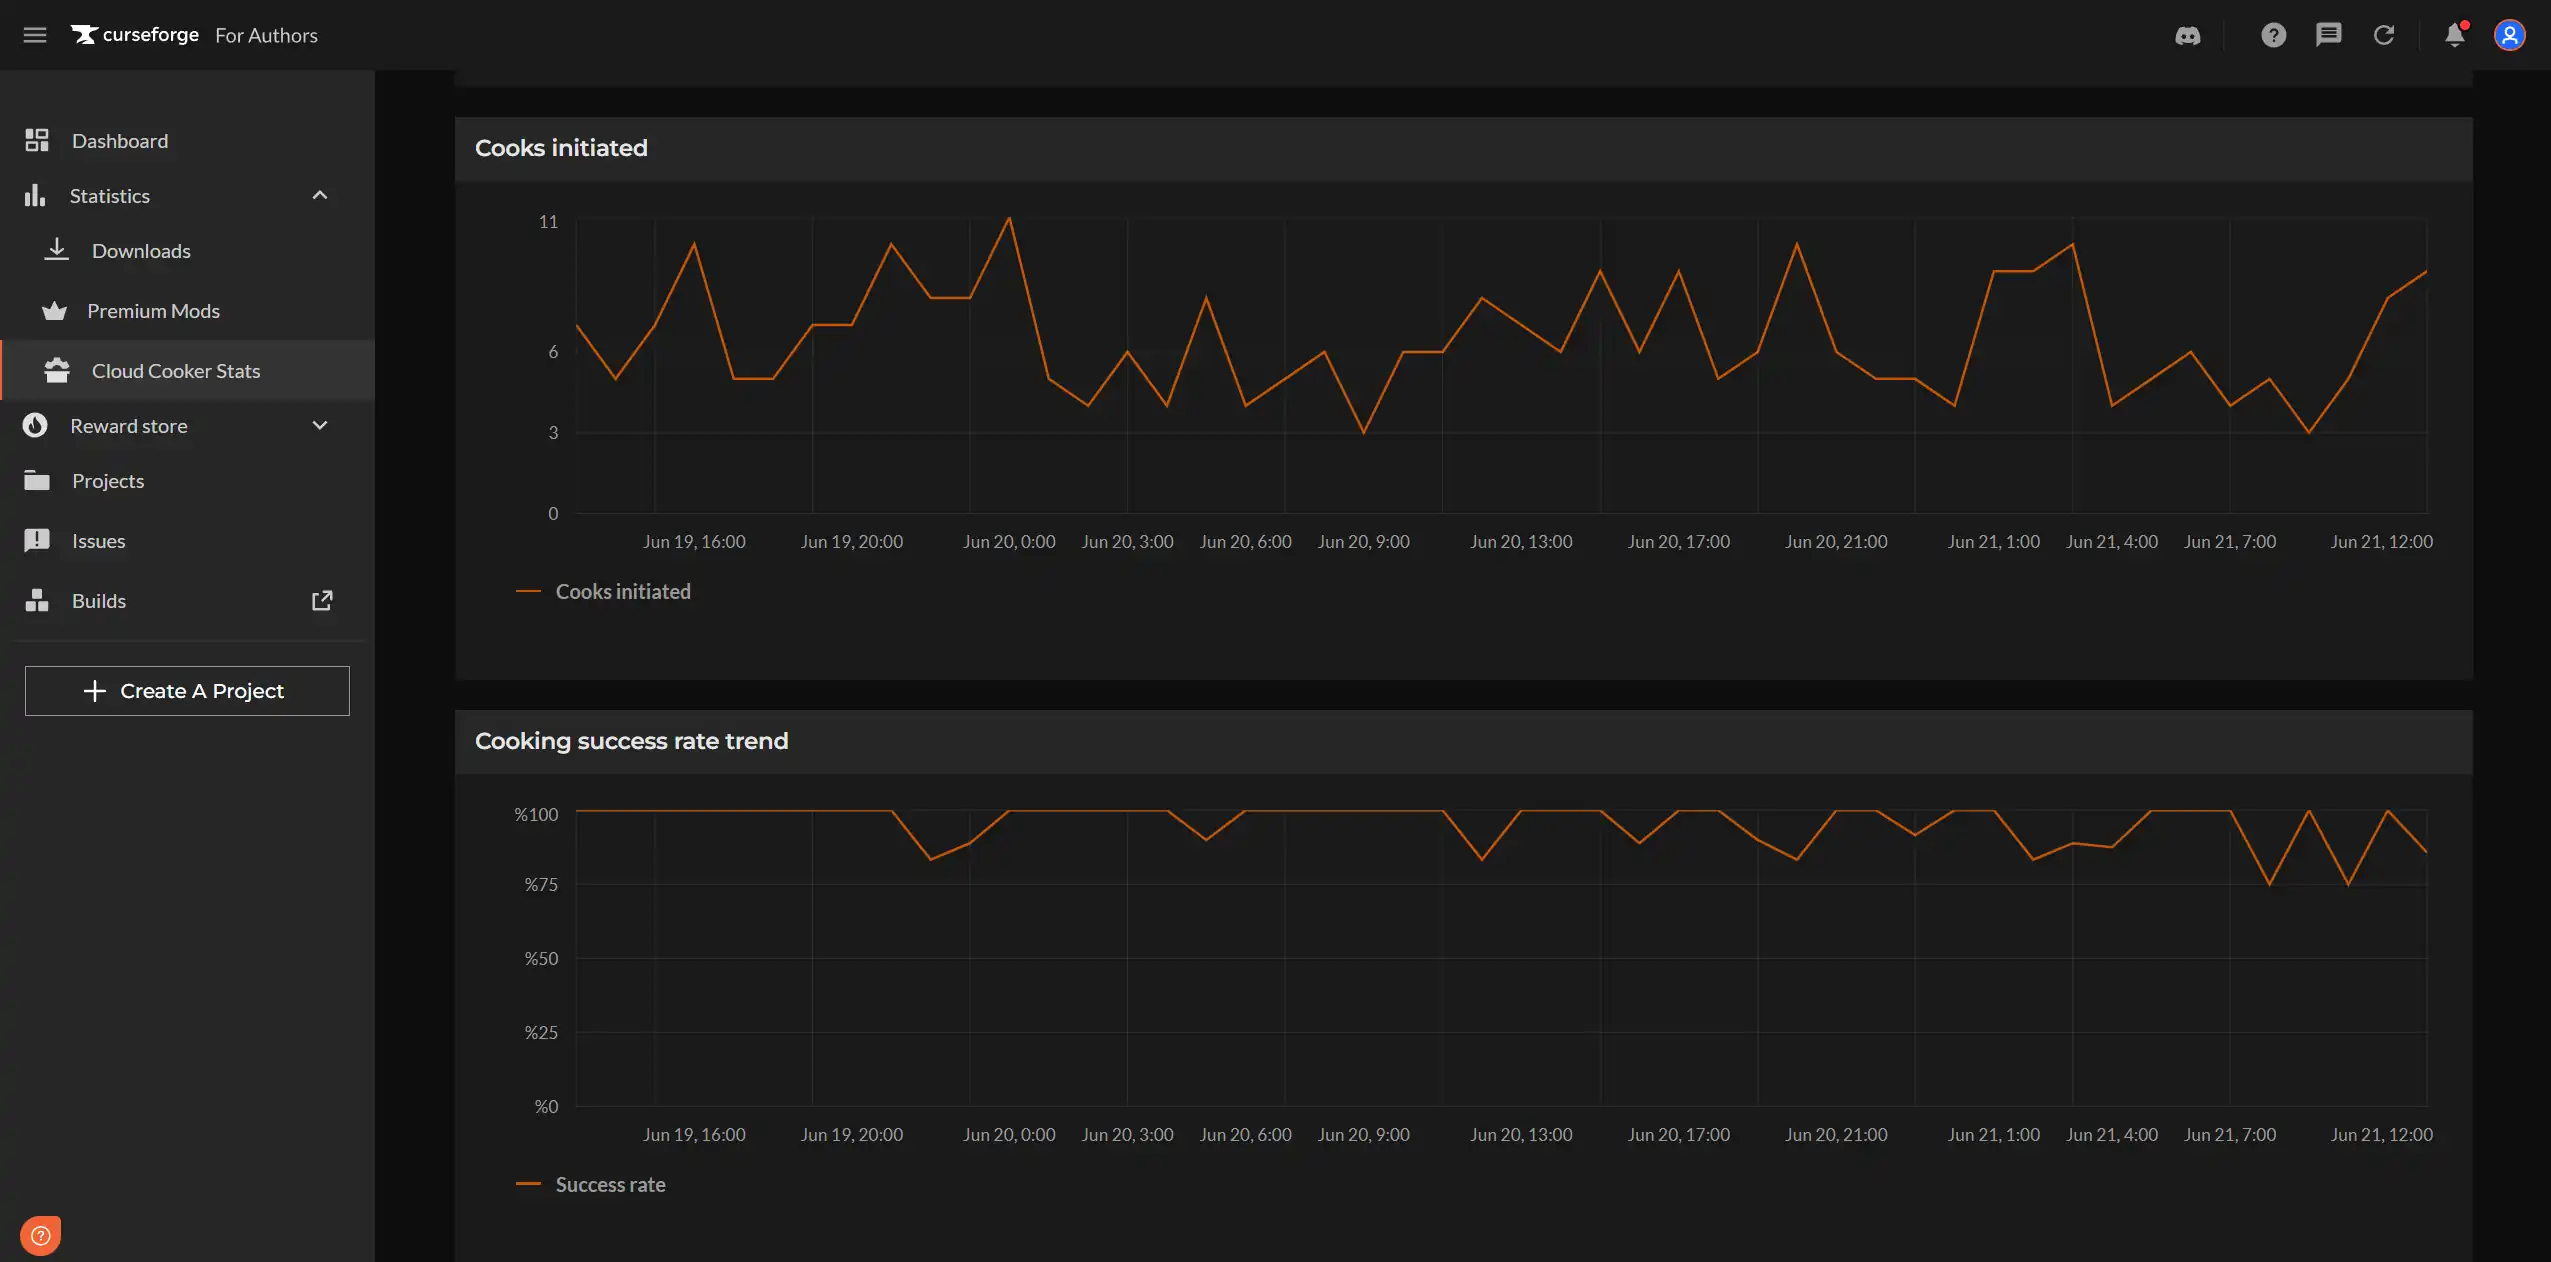
Author-facing dashboard. Accessible from the CurseForge for Authors portal under Statistics > Cloud Cooker Stats. Shows the cooking performance for mods the author has submitted, filterable by game.
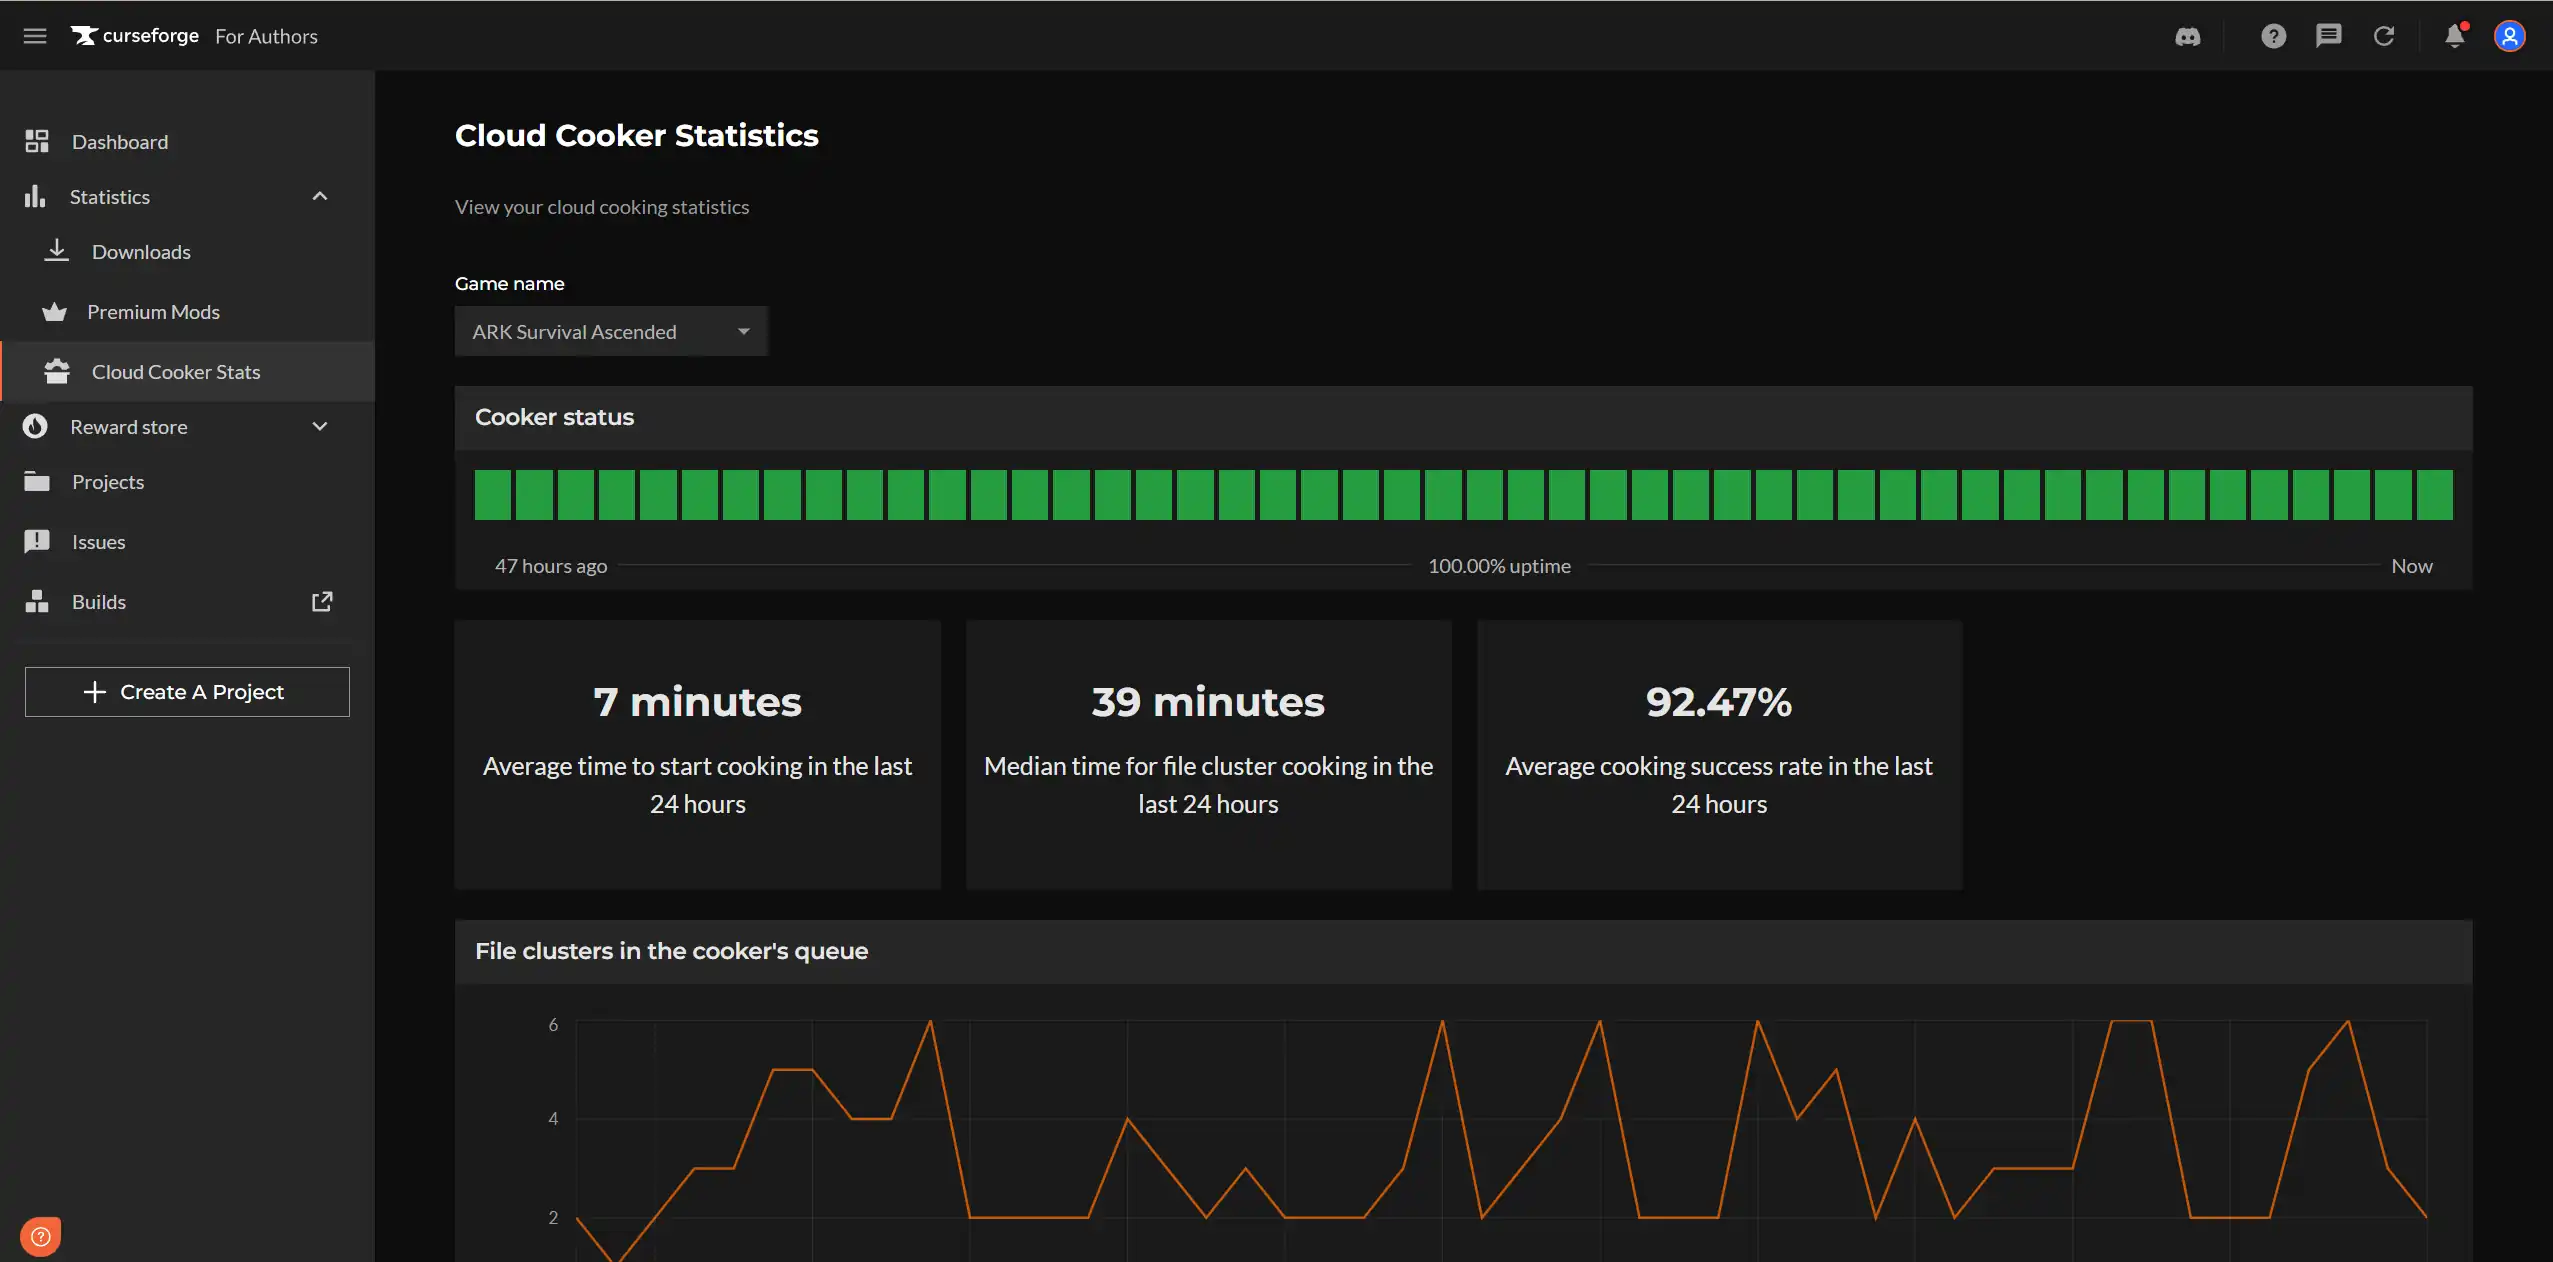
| Widget | What it shows |
|---|---|
| Cooker status | Uptime visualization for the last 48 hours. Each block represents a time interval; green indicates the cooker was operational. Overall uptime percentage is shown. |
| Average time to start cooking | Average time from cook submission to cooking starting, measured over the last 24 hours. |
| Median time for file cluster cooking | Median duration for a full file cluster cook to complete, measured over the last 24 hours. |
| Average cooking success rate | Percentage of cooking jobs that completed successfully in the last 24 hours. |
| Cooks initiated | Time-series chart of the number of cook jobs submitted over time. |
| Cooking success rate trend | Time-series chart of cooking success rate (%) over time. Use this to spot degradation periods. |
| File clusters in the cooker's queue | Time-series chart of queue depth over time. Spikes indicate periods of high submission volume or cooker slowdown. |
Downloads - Author facing
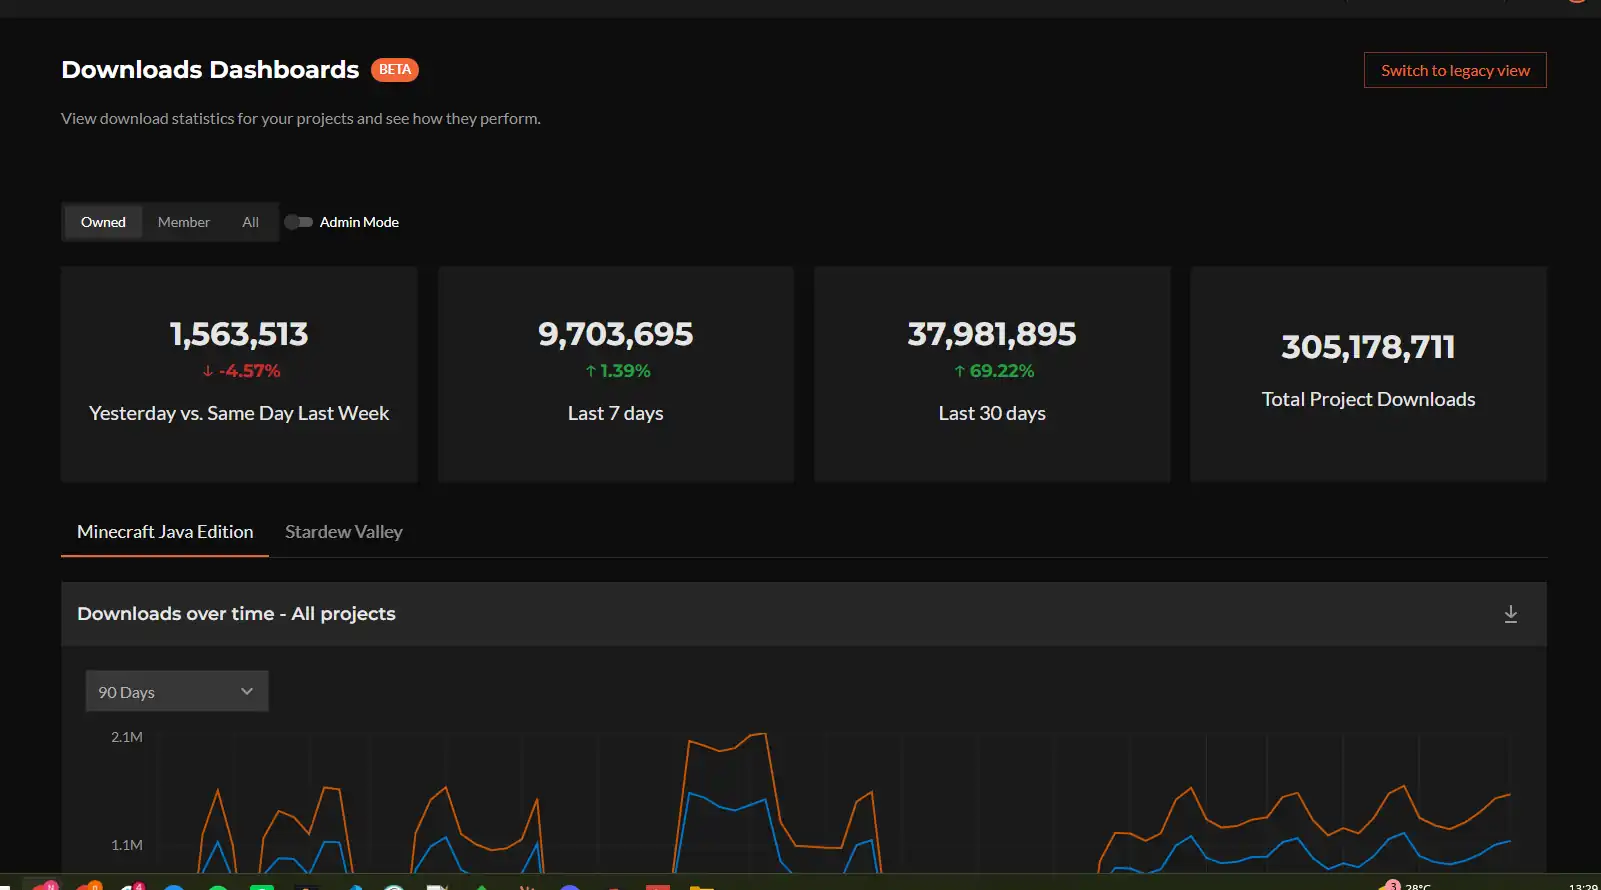
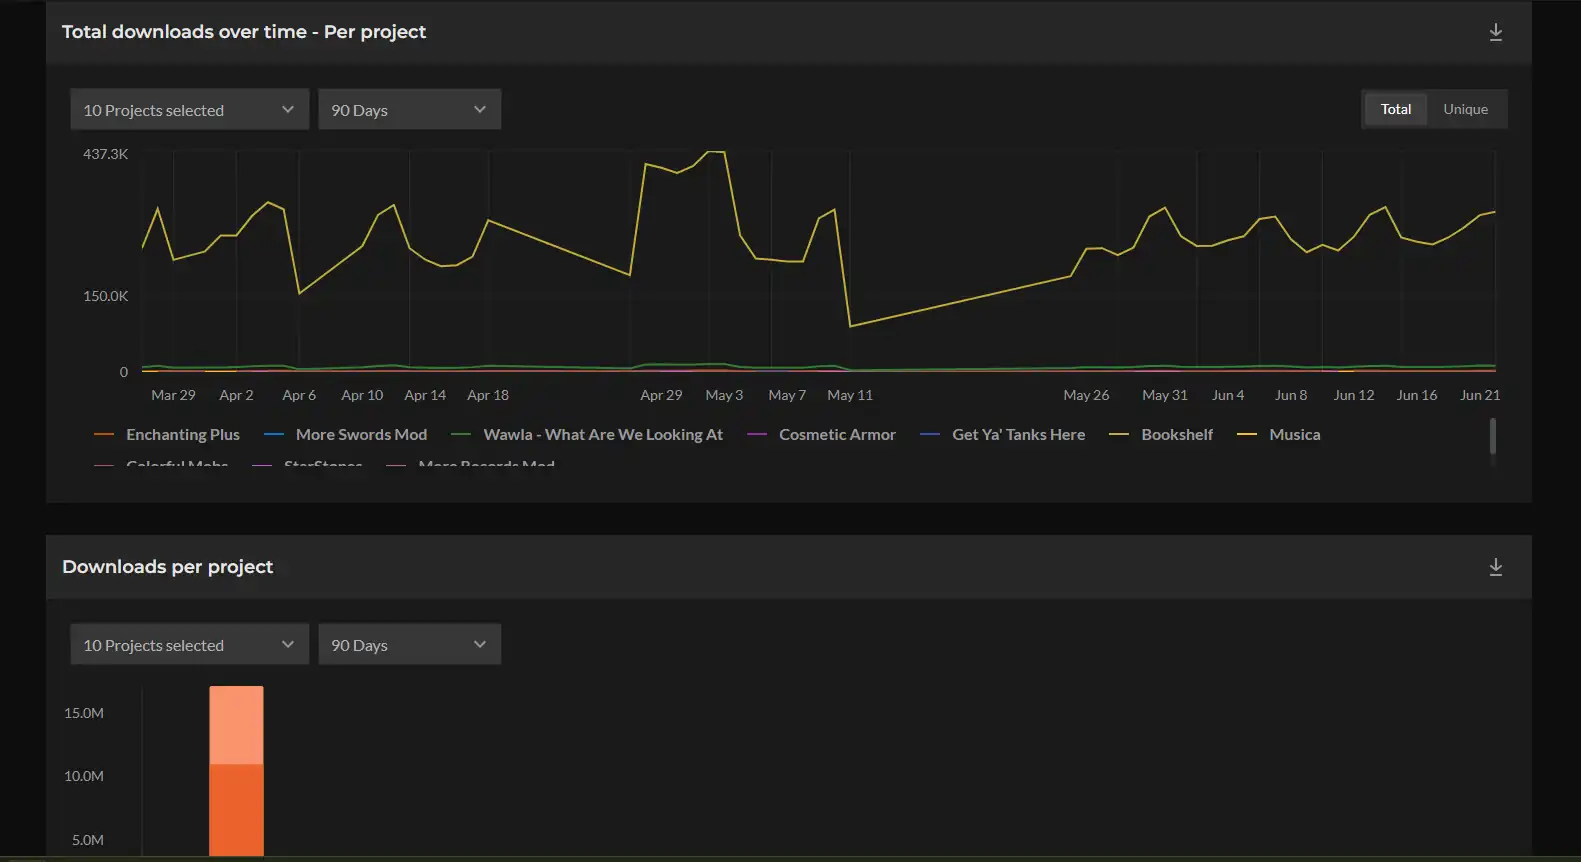
Each author sees data for their own mods only, filterable by game (tab per game) and by time period. Charts can be filtered to specific projects or viewed across all projects.
| Widget | What it shows |
|---|---|
| Yesterday vs. Same Day Last Week | Yesterday's download count with a percentage change indicator vs. the same day the prior week. Red/green indicates direction. |
| Last 7 days | Total downloads in the last 7 days with a percentage change vs. the prior 7-day period. |
| Last 30 days | Total downloads in the last 30 days with a percentage change vs. the prior 30-day period. |
| Total Project Downloads | Cumulative all-time downloads across all the author's published mods. |
| Downloads over time — All projects | Time-series of Total Downloads and Unique Downloads across all mods. Filterable by time period. |
| Total downloads over time — Per project | Multi-line time-series showing downloads per individual mod. Toggle between Total and Unique. Filterable by project selection and time period. |
| Downloads per project | Bar chart comparing Total Downloads vs Unique Downloads per mod. Useful for identifying top-performing content. |